
.png?width=500&height=268&name=TRAZER%20Teachable%20Course%20Cover%20(2).png "TRAZER+ 201")
Activity Categories
- Assessments
-
Standardized assessments are a great way to measure baseline performance and establish a benchmark for future progress. Assessments provide an objective and consistent measure of a User's movement.
- Assessments record performance metrics in a single direction or in multiple directions. These Assessments include Balance, Kinematic, Neuromechanics, and Dynamic Movement, as well as combinations of these. Users should strive to perform at their highest possible level with maximum exertion every time they perform an Assessment, this helps to ensure accurate measurements of performance.
-
- Rehabilitation
- TRAZER Rehabilitation includes 6 phases of Neuromechanical rehabilitation for Ankle, Knee, Hip, Concussion, Balance, and Vestibular through scripted exercise sessions. Sessions progress from very low amplitude, recently weight-bearing tasks to aggressive, return-to-function challenges.
- Workouts
- Workouts feature mobility-based protocols that can be used for performance enhancement as well as for basic exercise. These are available in graduating levels of difficulty for progression over time.
- Drills
- Drills are used to build strength and technique in targeted directions and movement patterns. Featured multiple adjustable settings include working for Time or Sets/Reps, selection of movement direction, movement distance, movement patterns, implementation of pauses, stance height, cue time on screen and more. Customized User Settings are retained until physically changed for speed and convenience when working with Users.
- Games
- TRAZER Games are proprietary fun Activities that work spatial awareness, balance, quickness, body control, recognition, and memory skill.
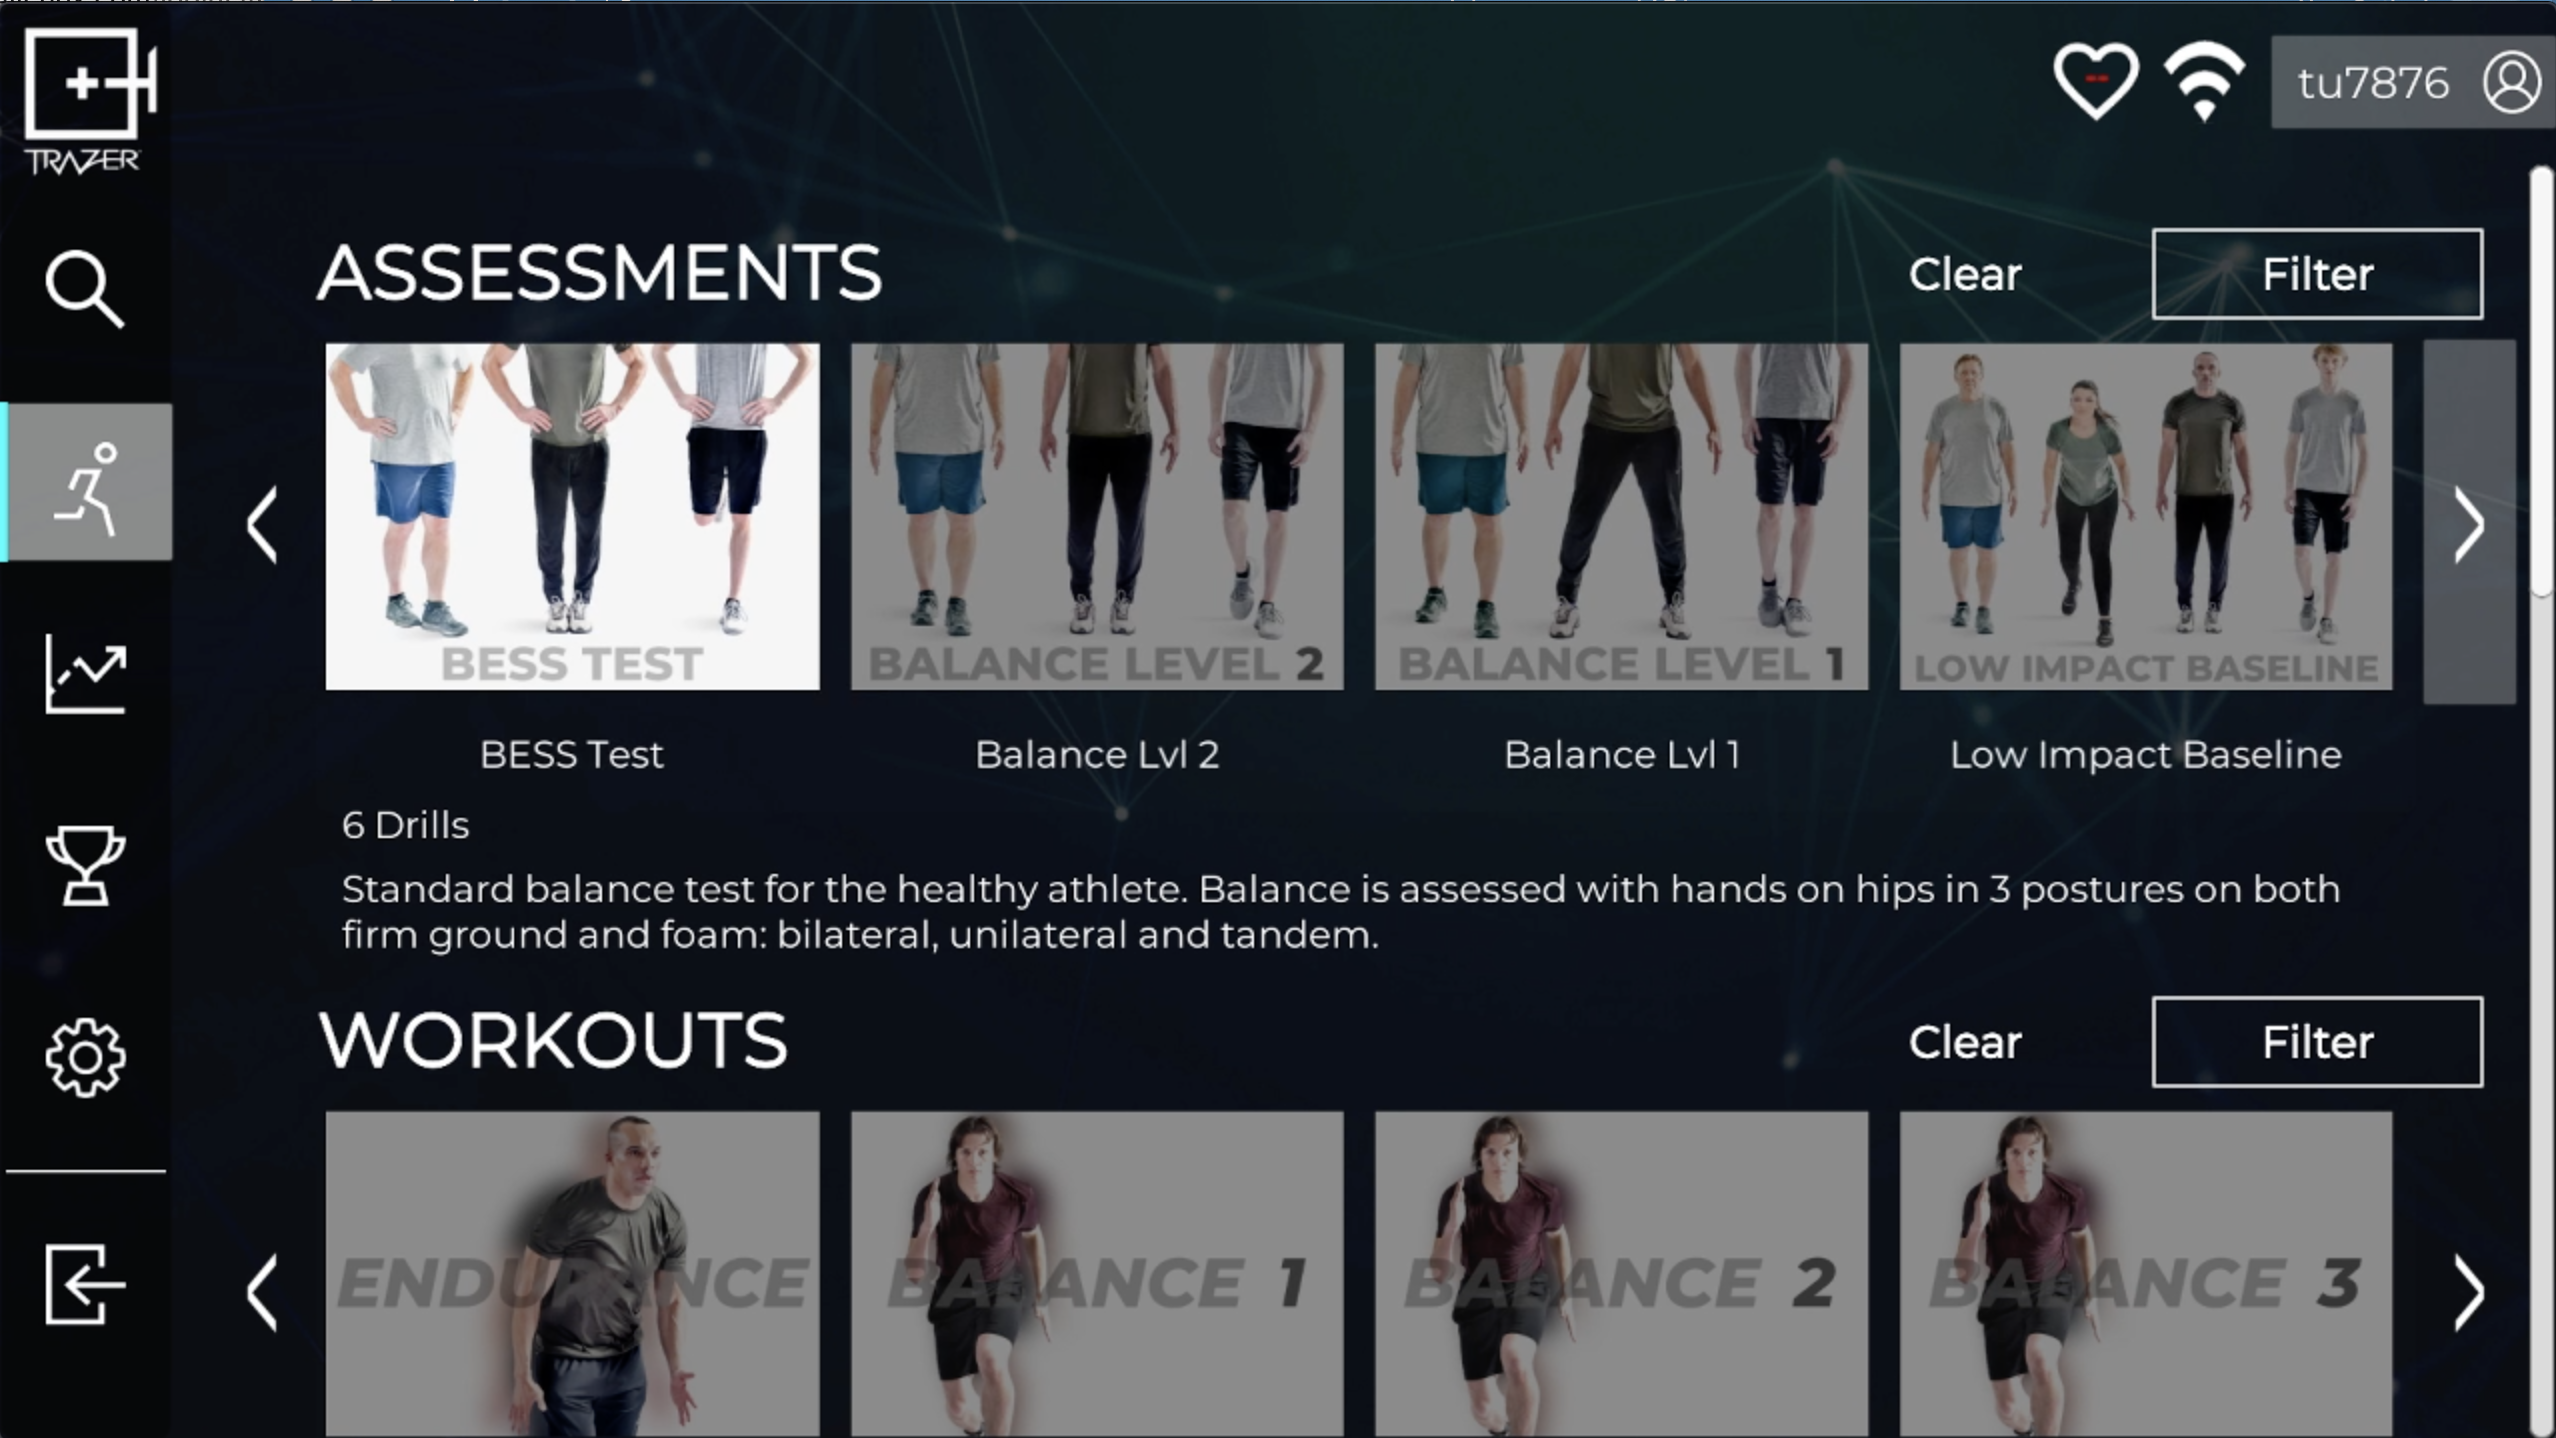
Some Activities are “Scripted Activities” which consist of as few as one, or a string of multiple activities. You will see the number of Drills - or Steps - when you hover over an Activity.
Types of Activities
Activities are built on the foundation of the 4 Pillars of TRAZER: Balance, Kinematics, Dynamic Movement, and Neuromechanics. Each takes a holistic, non-isolated approach to assessment, rehabilitation, and training by integrating the brain + body.
Continue reading for a deep-dive into each.
What is Balance?
TRAZER Balance Activities were developed to provide an objective and reproducible method of assessing static postural stability, or more commonly known as "balance".
There are 3 different levels of difficulty: Balance Level 1 (lowest level), Balance Level 2 (moderate) and the BESS Test (highest). For Users that are able to stand (walkers and gait belts can be used for assistance), these Activities assess balance capability.
Balance Activities objectively measure and report a User's adherence to required stance(s) in Sway and Misses.
Misses that are marked depend on the level of difficulty and include:
- Moving the hands off the hips
- Stepping, stumbling, or falling
- Abduction or flexion of the hip beyond 30˚
- Lifting the forefoot or heel off the testing surface
- Remaining out of the proper testing position for 5 seconds or longer
- Toe less that 2" from the floor in unilateral position
Balance Activities assess the 3 following postures at different levels of adherence:
- Bilateral - double leg stance
- Unilateral - single leg stance
- Tandem - staggered leg stance
To ensure accurate measurement, pay attention to the instructions for each Activity for stance requirements.
Watch TRAZER Co-Founder, Barry French Jr., demonstrate Balance Activities and the different postures for each level of difficulty:
Metrics + Reporting
Balance Reports objectively quantify Misses and Sway in each Step of the Activity. When using the report, you would click on Choose Step (below Session Summary) to select the steps and view the metrics.
.png?width=800&height=450&name=Screenshot%20(172).png)
The top left section of the Overview report lists each type of Miss detected as well as the number of Misses for that type, and the Total Misses.
The bottom left section displays the Sway distance in feet for all 8 directions.
The right side of the report displays the Sway distances in a spider graph to visualize summarized Sway metrics during the Activity.
Top Activities
- Balance Level 1
- A multi-step balance test of Bilateral, Unilateral, and Tandem postures with the lowest level of stance adherence requirements.
- Balance Level 2
- A multi-step balance test of Bilateral, Unilateral, and Tandem postures with a moderate level of stance adherence requirements.
- BESS Test
- A multi-step balance test of Bilateral, Unilateral, and Tandem postures with the highest level of stance adherence requirements.

What is Kinematics?
TRAZER Kinematic Activities measure the joint angles in the body as it moves. These Activities are based on tracking and measuring positional metrics without markers or attachments.
Kinematics Activities display data in real-time during the Activity and report average metrics for all repetitions as well as averages per repetition:
- Stance Width
- Trunk Flexion
- Pelvic Tilt
- Right and Left Knee Valgus Varus
- Right and Left Knee Flexion
- Right and Left Knee Dorsiflexion
In these Activities, the User will see a live view of themselves on screen with skeletal tracking.
Watch TRAZER Co-Founder, Barry French Jr., demonstrate Kinematic Activities + Reporting:
Metrics + Reporting
The Overview report summarizes data from all of the completed reps.
.png?width=1920&height=1080&name=Screenshot%20(164).png)
The left side of the report displays averages for each metric:
- Stance Width Ratio
- Stance Width Distance
- Trunk Lean
- Pelvic Tilt
- Right and Left Knee Valgus Varus
- Right and Left Knee Flexion
- Right and Left Knee Dorsiflexion
The right side of the report displays the metrics overlaid on a silhouette in the location corresponding to the measurement so that differences between the Left and Right sides can be easily seen.
.png?width=1920&height=1080&name=Screenshot%20(165).png)
The Reps tab of the report displays metrics for each of the completed reps.
Top Activities
- Squat
- A 5-rep squat test to measure lower extremity joint angles.
- Single Leg Squat
- A 5-rep single-leg squat test to compare lower extremity joint angles of the Right and Left legs.
- Vertical Drop Jump
- A 5-rep box jump test from a minimum height of 12 inches (30 cm) to measure lower extremity joint angles.
What is Dynamic Movement?
TRAZER Dynamic Movement Activities offer a unique, reaction-based approach to assessment, rehabilitation, and training.
By providing uncontrolled stimuli, TRAZER allows Users to simulate the environments they would encounter in the real world. This type of immersive experience is especially beneficial for activating the sensory, cognitive, and neuromuscular systems, which gives you more relevant and accurate data about a User's movement and function.
Dynamic Movement Activities are designed to assess movement patterns in order to accurately identify and address any areas of weakness. These Activities provide powerful insight that can be used to fully understand, repair, and/or improve an individual's movement capability. This allows for the development of personalized treatment, training, and/or rehabilitation plans that can lead to better outcomes in the short and long-term.
- Respond to unexpected stimuli
- Challenge spatial awareness with immersive simulation
- Problem-solve to complete visual tasks
In these Activities, the User appears in the simulation as an avatar, they will see targets appear somewhere on the on-screen grid. As the User moves to the target, the avatar will reflect their movement on screen so the User can visualize their proximity to the target.
While the User is moving to targets as they appear, TRAZER is locked onto 25 points on their body. TRAZER is tracking the User's ability to react and move in certain directions and patterns. TRAZER is also testing and tracking the User's ability to stop, start, and change direction - just like they would in sport or life. This allows providers to identify the User's asymmetries in movement patterns that could go unnoticed otherwise.
Watch TRAZER Co-Founder, Barry French Jr., demonstrates and explains TRAZER Dynamic Movement Activities + Reporting:
Metrics + Reporting
When an Activity is completed, the report will display on screen. The Report is segmented into the sections displayed at the top of the screen: Overview, Symmetry, Timeline, and History. Select the specific Step of a Scripted Activity by using the "Choose Step" drop-down menu (located under Session Summary). .png?width=800&height=450&name=Screenshot%20(175).png)
The Overview section shows the Overall Details as well as the details by Step.
- Overall Details: Summarized metrics from the start of the Activity - including calibration - to the end of all the Steps in the Activity.
- Step Details: Details from the Step selected in the "Choose Step" drop-down. In the example illustrated above, there was only 1 Step in the Activity so some of the metrics are the same. A difference in the Duration might be noticed. The Overall Duration includes the time prior to and during calibration.
- Averages for key metrics are also displayed: Heart Rate, Speed, Reaction Time, Acceleration, Deceleration, Jump Height, and Squat Depth.
In the Symmetry section of the Report, we will look at Reaction Time, Speed, Acceleration, and Deceleration in greater detail.
.png?width=800&height=450&name=Screenshot%20(176).png)
Dynamic Movement Activities measure 4 main data sets, all critical aspects of movement: Reaction Time, Speed, Acceleration, and Deceleration.
Illustrated on the left, the Symmetry Report is an average of the reporting metric and lists all directions of the targets enabled in the Step of the Activity selected. Metrics are plotted on a spider graph to the right.
Asymmetries are reported at the bottom of the list.
TRAZER highlights the severity of asymmetry between directions through color codes. The difference is displayed as a percentage and to which side.
- Under 10% = green, symmetrical
- Between 10-20% = yellow, asymmetry detected
- Above 20% = red, significant asymmetry detected
Reaction Time is the elapsed time from the presentation of a visual cue to the User's initial purposeful movement, i.e. the first foot to move in the correct (prescribed) direction. It is believed that this construct is more reflective of sport-specific movement, more intuitive for the User, as well as more accurately characterizing the User's visual-cognitive-neuromuscular linkage.
.png?width=800&height=450&name=Screenshot%20(177).png)
Clicking on the Speed tab in the Symmetry section of the Report, shows the User is more symmetrical, however is still showing an asymmetry favoring the Left.
Speed is the rate of movement in feet per second for the entire duration of the Step.
.png?width=1920&height=1080&name=Screenshot%20(178).png)
Acceleration is direction sensitive.
Acceleration (“1st Step Quickness”) is measured from the point the first step or movement is taken toward the target/concentric. When the User decreases their speed and moves away from the target/eccentric, the movement is reported as Deceleration.
Acceleration is the change in velocity of the User's body core as the User moves to the TRAZER-prescribed Target.
.png?width=1920&height=1080&name=Screenshot%20(179).png)
Deceleration is indicative of the User's stopping power. In sport, this can be referred to as an athlete’s ability to “stick it”, that is to reach a target and explode away. Muscular instability that interferes with the User's ability to slow down and stop can lead to injury (blown ACL or a fall for a senior).
Deceleration is the opposite of acceleration. Deceleration assesses the User's ability to decrease speed for one of two objectives: either to brake as the User acts to satisfy ("land on") the TRAZER-display target, or to decelerate in order to effect a smoothly executed “transit” to another target as practiced in an agility drill.
-1.png?width=1920&height=1080&name=Screenshot%20(180)-1.png)
The Timeline Report illustrates these metrics and their changes throughout the Activity as well as heart rate.
On the left side, metrics are listed for:
- Start of Activity
- Minimum during Activity
- Maximum during Activity
- Average for Activity
- End of Activity
On the right, the metric is charted at 10-second intervals through the course of the Activity to see peaks and valleys.
-1.png?width=1920&height=1080&name=Screenshot%20(181)-1.png)
The History section provides insight into the User's previous sessions of the Activity. The chart can be filtered by All, Completed, or Partial tests.
Comparing Tests
To compare 2 tests, click the Compare ![]() icon at the top right. Click the checkboxes next to the 2 tests to compare, then click Compare.
icon at the top right. Click the checkboxes next to the 2 tests to compare, then click Compare.
-1.png?width=1920&height=1080&name=Screenshot%20(183)-1.png)
Now we will see all of the same metrics for 2 tests, Test 1 and Test 2. Test 1 will always be the first test (by date and time) of the 2 selected.
You will also see a difference percentage displayed. Improvements are displayed in green and degradations (or no improvement) are in red.
-1.png?width=1920&height=1080&name=Screenshot%20(184)-1.png)
In the Symmetry tab, we will see Test 1 metrics versus Test 2 metrics and again, the Difference between them. On the right, both are overlaid on the spider graph to visualize the differences.
Top Activities
ASSESSMENTS
- RAS-90 (Reactive Agility Screen 90)
- 90-second test that measures a User's movement in multiple directions toward randomly appearing targets.
- LAS-90 (Lateral Agility Screen 90)
- 90-second test that measures a User's side-to-side movement toward randomly appearing targets to highlight imbalances.
- LAS-20 (Lateral Agility Screen 20)
- 20 randomly appearing targets to the Left and Right of the User allow for isolated measurement of dynamic reaction time and movement symmetry.
- Vector Test
- This multi-step movement capability test isolates linear, lateral, diagonal, and vertical movement.
- Linear
- A single-step test where the User moves forward to a target for 10 repetitions to measure the speed and efficiency of movement.
- A single-step test where the User moves forward to a target for 10 repetitions to measure the speed and efficiency of movement.
- GPA 30, 60, or 120
- A dual-task progressive test of a User's response to randomly appearing targets with demand for increased speed every X seconds.
- GPA 30 = increased demand every 30 seconds
- GPA 60 = increased demand every 60 seconds
- GPA 120 = increased demand every 120 seconds
- A dual-task progressive test of a User's response to randomly appearing targets with demand for increased speed every X seconds.
DRILLS
- React
- Test or Train reactive agility in multiple directions.
- Shift and Bump
- Full directional reaction activity. Can be used for very low amplitude movement such as hip-shifts and toe raises.
- Lateral
- Test or Train agility and speed in isolated lateral movements by directing Users to repeat a consistent pattern.
- Box Drill
- Test or Train agility in forward, backward, and lateral movement.
- Get Back
- Tests or Trains first step quickness by directing the User to aggressively move (or "burst") in any of 5 forward angles and then return by quickly backpedaling to the starting position.
Customizations
Scene
All Dynamic Movement Activities allow Scene customizations.
%20(1).png?width=1920&height=1080&name=Screenshot%20(108)%20(1).png)
From the preview screen, click Scene at the top right.
.png?width=1920&height=1080&name=Screenshot%20(89).png)
Here the simulation scene for the Activity can be changed.
You can also turn the grid off by de-selecting the Show Grid checkbox. This adds additional spatial awareness complexity for the User.
Settings
Settings can be modified in the Drills category. The available settings will depend on the Activity. This allows you to customize Activities to the needs of your User. Settings are retained for each User.
![ShiftAndBump1[75]](https://university.trazer.com/hs-fs/hubfs/ShiftAndBump1%5B75%5D.png?width=1546&height=866&name=ShiftAndBump1%5B75%5D.png)
The Shift and Bump drill is one of the most versatile, with a large variety of settings.
- Duration Type
- Time - The Activity will end after the Game Duration seconds established below.
- Volume - The Activity will end after a set number of sets and reps (these settings will display once Volume is enabled).
- Left Movement
- When On, targets to the left side of the User will appear. When Off, no targets will appear to the left.
- Right Movement
- When On, targets to the right side of the User will appear. When Off, no targets will appear to the right.
- Forward Movement
- When On, targets in front of the User will appear. When Off, no targets will appear in front.
- Back Movement
- When On, targets behind the User will appear. When Off, no targets will appear behind.
- Up Movement
- When On, targets above the User will appear (heel raise). When Off, no targets will appear above.
- Down movement
- When On, targets below the User will appear (squat). When Off, no targets will appear below.
![ShiftAndBump2[8]](https://university.trazer.com/hs-fs/hubfs/ShiftAndBump2%5B8%5D.png?width=1548&height=865&name=ShiftAndBump2%5B8%5D.png)
- Movement Sequence
- When Random is selected, targets will appear in random directions. This should be selected for accurate Reaction Time measurements.
- When Sequential is selected, targets will appear in a repeated pattern, one direction to the next.
- When Group is selected, targets will appear grouped by direction and set - all targets in a specific direction will appear before moving to another direction for the set, and then will repeat for the next set. Group is only available under Volume Duration Type.
- Movement Scale
- When On, you can adjust distance (in inches) that the targets will appear from center. The movement directions will display below - click the - or + icons to adjust the inches for that direction.
- When Off, the Activity will follow default distances.
![ShiftAndBump3[66]](https://university.trazer.com/hs-fs/hubfs/ShiftAndBump3%5B66%5D.png?width=1545&height=867&name=ShiftAndBump3%5B66%5D.png)
- Pause Control
- When On, a pause will take place between target clearance and appearance. When On is slected, the Pause time (s) will display. We recommend a 1 second Pause for the most accurate Reaction Time measurement.
- When Off, targets will appear immediately after clearing a previous target.
- Standing or Sitting
- Standing should be selected if your User will be standing during the Activity. The avatar will appear standing, as they are.
- Sitting should be selected if your User will be sitting in a wheelchair during the Activity. The avatar will appear in a seated position.
What is Neuromechanics?
What is neuromechanics? The term may seem complex, but when you break it down, it's simple. Neuro is the brain processing; mechanics is the body moving or functioning.
The textbook definition “is an area that attempts to combine the efforts of muscles, sensory organs, pattern generators in the brain, and the central nervous system itself to explain motion.“
Healthcare has traditionally tried to break the body down into its individual parts and their isolated capacities: how strong is a knee or shoulder when extending with weight in a single direction? But the body doesn't work that way. The body is a complex interaction of systems that work together in a holistic fashion to allow the individual to function at their optimal level.
TRAZER's Neuromechanic Activities are similar to the Dynamic Movement activities, but introduce a dual-task. These Activities introduce cognitive problem-solving in combination with reaction-based movement, so that the Subject must SEE – SENSE – PROCESS – EXECUTE. These activities employ a unique, Cognitive Report that records both R/L Time to Target and correct / incorrect responses to congruent and incongruent challenges and are used for both orthopedic and concussion/stroke assessment and rehabilitation.
In these activities, the User will be presented with a visual challenge - or prompt - and 2 targets. They first need to solve the cognitive task to choose which target to move to.
Our Co-Founder explains and demonstrates Neuromechanic Activities + Reporting:
Metrics + Reporting
Reports for Neuromechanic Activities include the same reports as Dynamic Movement Activities but have an additional report section: Cognitive.
.png?width=1920&height=1080&name=Screenshot%20(190).png)
The Cognitive Report breaks down Score and Average Time to Bumper by Congruent cues and Incongruent cues.
The Score section displays the number of correctly and incorrectly executed targets to the Left and Right sides and the Difference between them.
The Average Time to Bumper section displays the time it takes the User to complete the task. This metric is a step further than Reaction Time as it reflects the time it takes the User to find their place in space (proprioception) and find their way to the target to complete the prompted task.
It is normal for a User to move faster to Congruent cues than Incongruent cues since Incongruent cues are a more complex task.
Top Activities
Neuromechanics Assessments display the cognitive task on screen for 500 ms (.5 seconds).
In the Drills category, settings are available to be able to adjust this "Prompt Time" or choose to keep the Prompt on-screen.
- Flanker (Available in Assessments and Drills)
- A test designed to measure reaction time in relation to cognitive function.
5 arrows appear on the screen pointing randomly to the left or right. The User must move to the target in the direction indicated by the center arrow.
- A test designed to measure reaction time in relation to cognitive function.
- Stroop (Available in Assessments and Drills)
- A test designed to measure reaction time in relation to cognitive function randomly using congruent and incongruent cues.
2 targets are positioned to the Left and Right of the User. Each target is labeled with a color. A WORD will appear on the screen. The User must read the WORD and move to the corresponding target. The WORD and the color of the WORD may not match.
For example, the WORD ""RED"" may appear in green. To be correct, the User must move to the target labeled in red.
- A test designed to measure reaction time in relation to cognitive function randomly using congruent and incongruent cues.
- NST (Neuromechanical Screening Test) Assessment
- A multi-step test to compare a User's reaction time in single-task repetitions to dual-task repetitions of lateral and diagonal movement.
Customizations
Scene
All Neuromechanic Activities allow Scene customizations.
.png?width=800&height=450&name=Screenshot%20(220).png)
From the preview screen, click Scene at the top right.
.png?width=800&height=450&name=Screenshot%20(221).png)
Here the simulation scene for the Activity can be changed.
You can also turn the grid off by de-selecting the Show Grid checkbox. This adds additional spatial awareness complexity for the User.
Settings
In the Drills Category, there are additional settings available for Neuromechanic Activities:
.png?width=1920&height=1080&name=Screenshot%20(208).png)
- Sound
- Sound is defaulted to Off.
- When Sound is set to On, when a task is completed correctly, a ding sound will play. When a task is completed incorrectly, a buzzer sound will play. (Volume can be adjusted with the TV remote.)
- Prompt Disappear
- Prompt Disappear is defaulted to On. This means the prompt will appear and then disappear.
- Prompt Time (ms) is enabled when Prompt Disappear is On. The default time is 500 ms, or 1/2 second.
- When Prompt Disappear is Off, the Prompt will remain on screen until the task is completed, and then the next Prompt will appear.
- Prompt Disappear is defaulted to On. This means the prompt will appear and then disappear.
- Visual Feedback
- When Visual Feedback is turned On, when a task is completed correctly, a green checkmark will display. When a task is completed incorrectly, a red X will display.
- When Visual Feedback is turned Off, the User will not know whether they were correct or incorrect until the end of the Activity.
TRAZER and Movement Asymmetries
In our fast-moving world our brains are constantly solving complex physics problems at multiple levels of difficulty to simply accomplish the activities of daily living. Links between the Brain + Body, along with movement patterns, identify how in sync the brain and body are. Asymmetries in movement patterns highlight a higher level of injury risk or when we are injured (musculoskeletal or concussion). TRAZER Activities integrate sensory, cognitive, and motor processes to generate measurement data that illustrates how well the brain and body are communicating – regardless of whether the injury is neural or orthopedic.
As we say at TRAZER:
All rehab is brain rehab. Regardless of age, injury, or capability, rehab must be physical and cognitive. The body cannot move without the brain. the connection between the brain and body must be re-established and strengthened - immediately post injury or surgery. TRAZER does both.
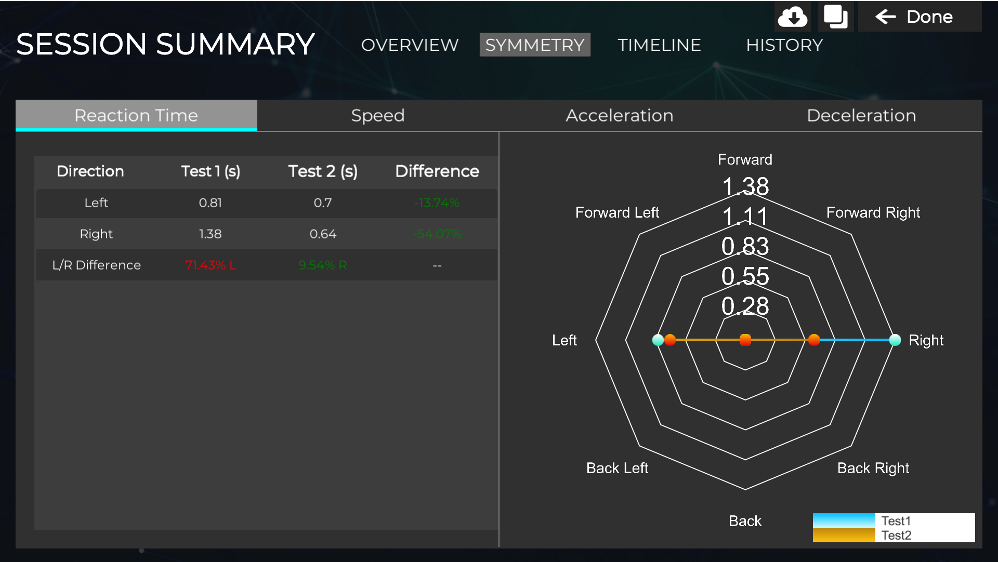
This Report, for example, is from a User who had a total right hip replacement 3 weeks prior to beginning TRAZER rehabilitation. The User utilized the TRAZER LAS (Lateral Agility Screen)-90 for serial testing to track incremental progression over time. Over a 2-1/2 month period, the User's Reaction Time to the right side, indicating a hesitancy to move in the direction of pain, went from a 71.43 % deficit to 9.54% positive.
The TRAZER Activities that isolate Left versus Right movements, such as the Lateral Agility Screens (LAS 20 and 90) or the Neuromechanical Screening Test (NST) are the most effective at highlighting both orthopedic and brain injury/disease asymmetries. In the case of an orthopedic insufficiency, Reaction Time will be slower to the injured side; Deceleration may be worse on the injured side. Acceleration may be better towards the injured side as push-off power from the healthy limb is stronger.
TRAZER provides a GREEN – YELLOW – RED stoplight report at the end of these Assessments to allow providers to plan care accordingly.
In orthopedics, normal, asymmetry of 10% or less (highlighted in GREEN) is good, and can be attributable to right-handed / left-handedness or training effect. An imbalance of 20.1% or more (highlighted in RED) indicates that the User is either injured or at a high level of risk of injury. These Users identify as needing more examination or physical therapy. And the range between (highlighted in YELLOW), from 10.1 to 20%, shows either that the User is coming back from the RED zone, or that they are in a less than optimal condition. The YELLOW Zone might indicate that the healthy User is heading into over-training syndrome, for example. Or that the injured User is progressing back to health – but not there yet.
When an injured User is at 25 – 30% of symmetrical movement, their pain level may be diminished to the point that they believe they can handle it on their own. Injured athletes and soldiers, in particular, are anxious to return to “the field of play.” Thus, they develop compensatory movement patterns that allow them to perform despite injuries. The brain compensates for weaknesses by adjusting energy ratios sent to other muscles, resulting in changes in loading of joints, which can lead to injury.
When treating/testing concussion or other brain issues, consider that the right side of the brain is responsible for processing visual information from both the left and right sides. In the absence of a head injury, it’s normal for performance to the left side to be slightly better; if there’s a disruption of connectivity in the brain + body network, the left visual field is neglected, resulting in better performance to the right side.
TRAZER sees what the naked eye can't, reporting imbalances to help providers prevent injury or to ensure that rehabilitation is complete before the User returns to “Life.”
The Brain + Body Concept
TRAZER is a neuromechanical technology, meaning it works the Brain + Body simultaneously. When an individual has suffered either a brain or an orthopedic injury, they are at greater risk of re-injury because the neural connections between brain and body have been disrupted. TRAZER Activities replicate the challenges encountered on the playing field or in the activities of daily life in order to re-establish and strengthen the connection between the brain + body.
TRAZER interactive stimuli challenge an individual's depth perception and spatial interpretation, and engage both brain and body together in active problem-solving. The goal is to enhance the brain’s ability to process visual information and subsequently mobilize the body to act upon this information. TRAZER reinforces proficient mind-body integration by requiring controlled physical movement to “resolve” cognitively demanding challenges, and, vice versa, requiring quick cognition to execute physical movement essential for interacting with the immersive simulation.
Reaction-based sports and activities of daily living demand real-time problem solving that involves brain + body integration as well as trained reflexive responses.
Harvard professor, Dr. John Ratey, MD, has explained that our hunter-gatherer ancestors had to strategize and move in order to find food, or avoid being food. Thus, our “thinking brain” developed over the last half million years from our “moving brain” as more and more complex, cognitive problem-solving was required to survive.
That primitive, moving brain, the Limbic System, is integrated throughout the various chambers of the brain, and is at the root of our functionality. It’s where positive and negative emotions reside – flight, fright, depression, fear, joy, confidence, and more. In order for neural sequencing resulting in successful Executive Function to progress, the Limbic System needs to be calmed, which video gaming is quite effective in accomplishing.
Serial Testing with TRAZER, i.e.: frequent repetition of the same Activity for comparison purposes, can reveal Intra-Individual Variability (IIV) in performance that may be indicative of a lack of efficiency in Executive Function, or the ability of the User to make a movement decision. Comparison of performance from time-to-time and over time can identify subtle impairment of neural function, for example, in an aging population or in the case of concussion history.
In comparing performance metrics of a single Activity, look for inconsistency. For example, Reaction Time Inconsistency (RTI) over a short period of time has been shown to be indicative of a neural processing deficit. Once the Limbic System has been calmed, the Salient Network can take over, shut down the Default Mode Network and activate Executive Function. If any of these actions is repressed, from an inability of the brain + body to communicate efficiently, it will be most apparent in the Reaction Time measure.
Performance metrics such as Speed, Acceleration and Deceleration are relevant only in the context of goal-directed whole-body movements that closely replicate sport-related maneuvers. (i.e.: TRAZER) Combining a cognitive challenge with execution of a sufficiently complex motor activity can clearly reveal performance deficiencies that are not apparent when the respective tasks are done separately, which is believed to be due to finite neural processing resources. Wilkerson, et al, “A Novel Approach to Assessment of Perceptual-Motor Efficiency and Training Induced Improvement in the Performance Capabilities of Elite Athletes,” Frontiers in Sports and Active Living Journal, 10/1/2021.
What is Reaction Time?
Reaction time is comprised of four distinct phases: the perception of and interpretation of the visual and/or audio cue, appropriate neuromuscular activation and musculoskeletal force production resulting in physical movement. It is important to note that Dynamic Reaction Time (DRT), which is specifically measured by TRAZER, is defined as a User's ability to react correctly in response to the simulated environment’s attempts to create an asynchronous event, or phase shift. DRT is the elapsed time from the moment the simulated environment changes to the User's initial movement along the correct vector path. In essence, DRT is a measurement of the User's ability to respond to continually changing, random cues in multiple directions.
Further, TRAZER tests and trains Dynamic Reaction Time to a single task (ST) and to a dual task (DT). Single task Activities present random targets in either lateral left / right directions or diagonal left / right directions, so that a User needs to process which direction to move in. Reported ST reaction time is defined as the average amount of time that elapses between the appearance of the visual target on the screen and 20 cm of the User's body core displacement in the correct movement direction.
Dual Task Reaction Time (DTRT) involves solving a cognitive task by choosing which of two correct targets to move to. The Flanker Activity is a popular training and testing tool for DTRT. In the Flanker Activity, 5 arrows appear at the top center of the screen, simultaneously with two targets. The User is prompted to move, either laterally or diagonally, in the direction of a center arrow. If all arrows are pointing in the same direction, this is a “congruent” challenge; if scrambled, it is an “incongruent” challenge. Lateral and Diagonal DTRT marks the lapsed time between the appearance of the Flanker arrows and displacement of the User's core 15 cm in the correct direction.
The on-screen cue for TRAZER’s DT Activities, such as Flanker, can be set to remain on the screen or to disappear after a period of time. In the Assessment area, the on-screen cue disappears every time at 500 MS (1/2 second). If a User has neuro-processing issues, the Prompt Disappear Time can be adjusted gradually in the Drills Settings to gradually re-train his brain. Race car drivers and high-level athletes train at 50 MS, 900 times faster than the 500 MS default setting.
Who can use TRAZER?
TRAZER was designed for individuals from 5 to 105 regardless of physical capability.
TRAZER has a very low Perceived Exertion Rate. Its immersive simulation experience engages Users and leads to longer and harder work sessions, resulting in stronger recovery over a compressed time frame.
TRAZER works with assistive devices. TRAZER only picks up the User and not their assistive device. Providers can also stand behind the User and use a gait belt or support device to help guide the User for safety concerns.
