

.png?width=50&height=50&name=Favicon%20(2).png)

These release notes include:

new FEATURES + FUNCTIONS
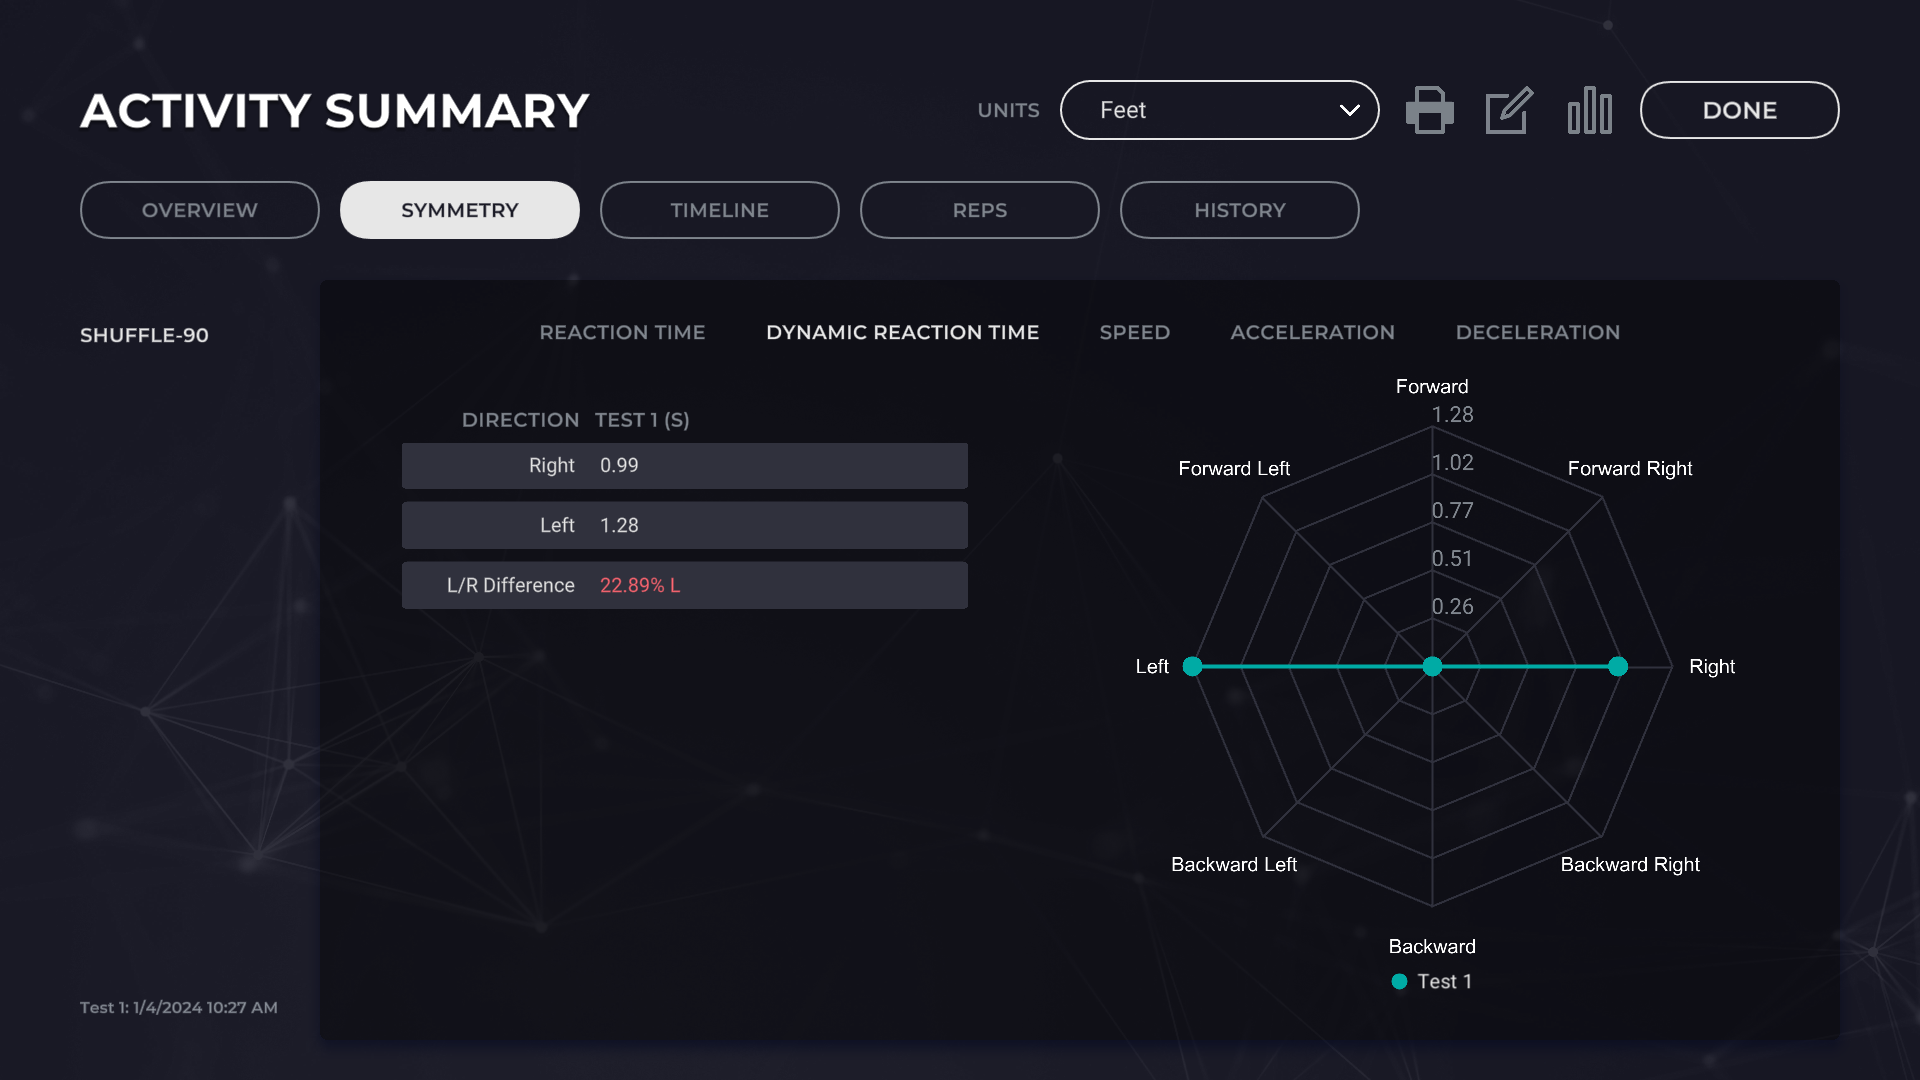
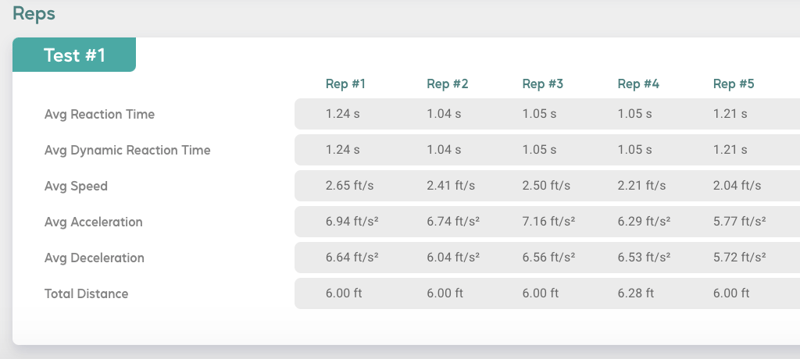
- Introduced Reaction Time and Dynamic Reaction Time™ metrics for Dynamic Movement and Neuromechanic Activities. Available in Overview, Symmetry, Cognitive, Reps (also new), and History reports.
- Reaction Time (RT) refers to the duration it takes for the User to move 20cm in any given direction. This metric captures the User's instinctive and immediate response to a target, showcasing their raw reaction or "knee-jerk" reflex.
- On the other hand, Dynamic Reaction Time (DRT) measures the time it takes for the User to move 20cm in the correct direction or, in the Neuromechanics Activities, towards the target they hit. This measurement assesses the User's ability to make effective decisions and move in the intended direction.
- When the Reaction Time and Dynamic Reaction Time align, it indicates that the User moved correctly without any hesitation. However, if the DRT is higher, it suggests that the User may have attempted to anticipate the target and reacted incorrectly or even changed their course before correcting themselves. In sport and life, it is crucial to not only respond quickly but also react appropriately.
- Although the historical TRAZER XP data remains unaltered, it has been remapped. Former Reaction Time data is now displayed as Dynamic Reaction Time, while the previously concealed raw Reaction Time is now presented as Reaction Time.
- Introduced Reps Reports for Dynamic Movement and Neuromechanic Activities. Now, providers can access detailed performance analysis for each repetition in the Activity. This valuable data can be conveniently viewed as either a table or a graph. The graph option is also available for Kinematics Activities.
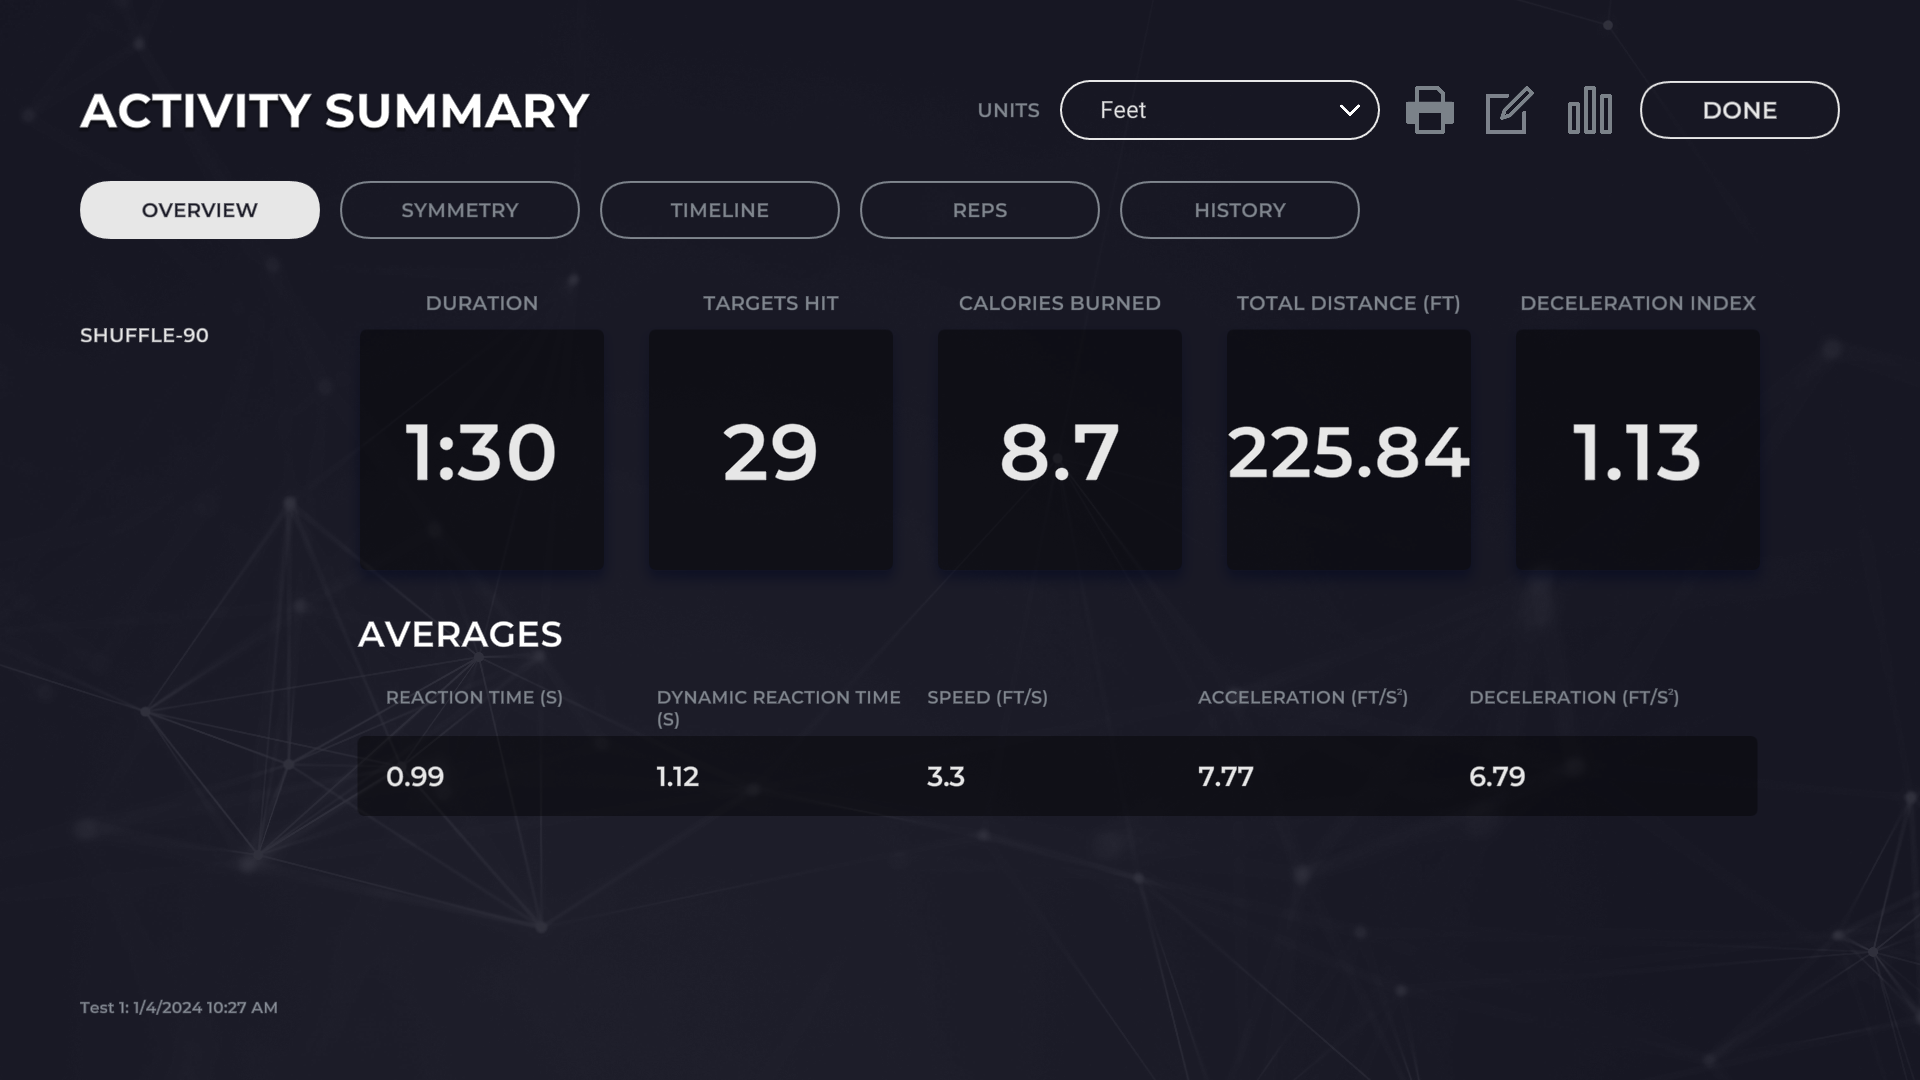
- Introduced the Deceleration Index metric for Dynamic Movement and Neuromechanics Activities, offering valuable insight into a User's maximum force ratio between deceleration and acceleration. Picture the analogy of the brakes versus the engine, as this metric sheds light on the User's ability to control their speed and momentum.
- Deceleration Index = Max Deceleration / Max Acceleration
- A value of 1 means the User's Max Acceleration and Deceleration were equal - they can stop and start at the same rate. Below 1, means the User can accelerate faster than they can decelerate. Above 1, means the User can decelerate at a faster rate than they can accelerate.
-
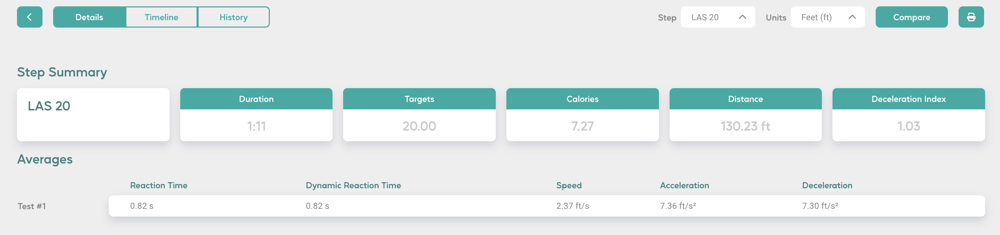
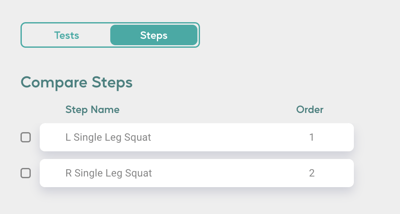
Added new functionality to compare steps of a multi-step Activity without the need to click back and forth between them. This allows providers to easily view and analyze the differences in motions or movement patterns within the Activity, making it even easier to identify areas of improvement.
-
Certain types of Activity steps can be directly compared, such as Balance to Balance and Kinematics to Kinematics. Additionally, Dynamic Movement and Neuromechanics steps can be compared to each other. Once one step is selected, any steps that cannot be directly compared will be disabled for selection.
-

Enhancements
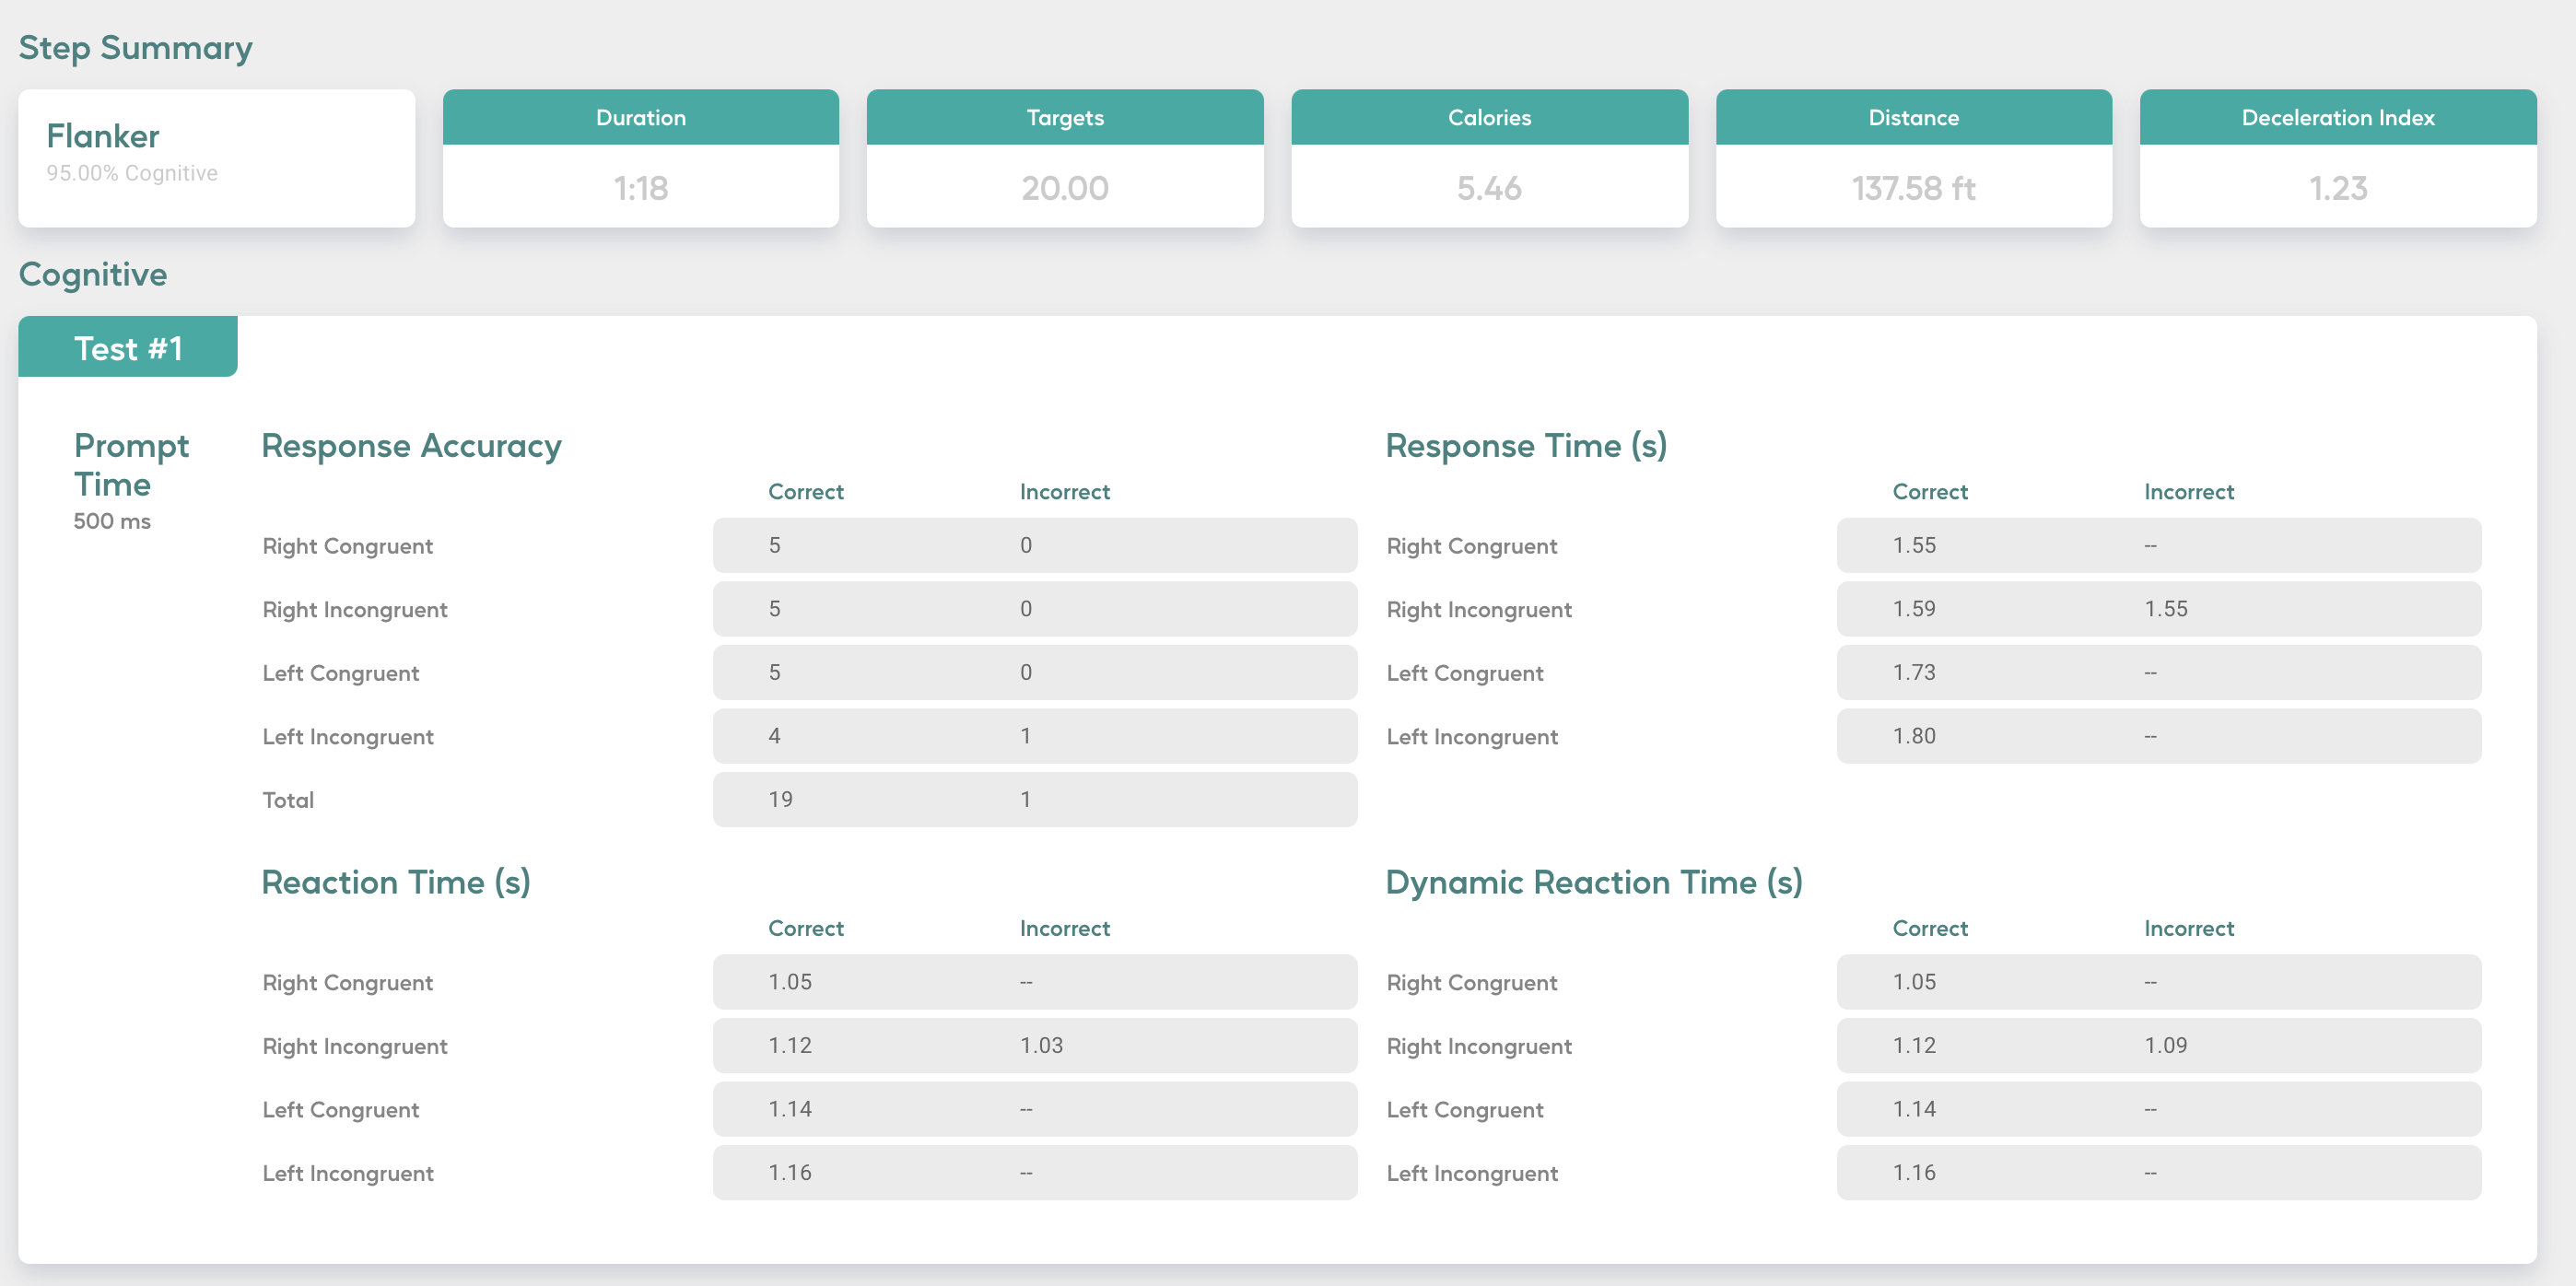
- Cognitive Reports have been redesigned and now include more data for a comprehensive cognitive analysis. These now feature two sections: Responses and Reaction Time.
-
- The previous Cognitive report data is now under the Responses tab and has undergone some changes, including new names and adjustments to data mapping. Targets Hit is now referred to as Response Accuracy, providing details on the prompts presented and the User's correct or incorrect responses. Similarly, Avg Time to Target has been renamed Response Time, focusing on the time taken by the User to reach the targets. Notably, the data is now appropriately mapped based on the User's movement direction, rather than the direction indicated by the prompt as it was previously done.
- The new Reaction Time tab displays the User's Reaction Time and Dynamic Reaction Time to the prompts presented.
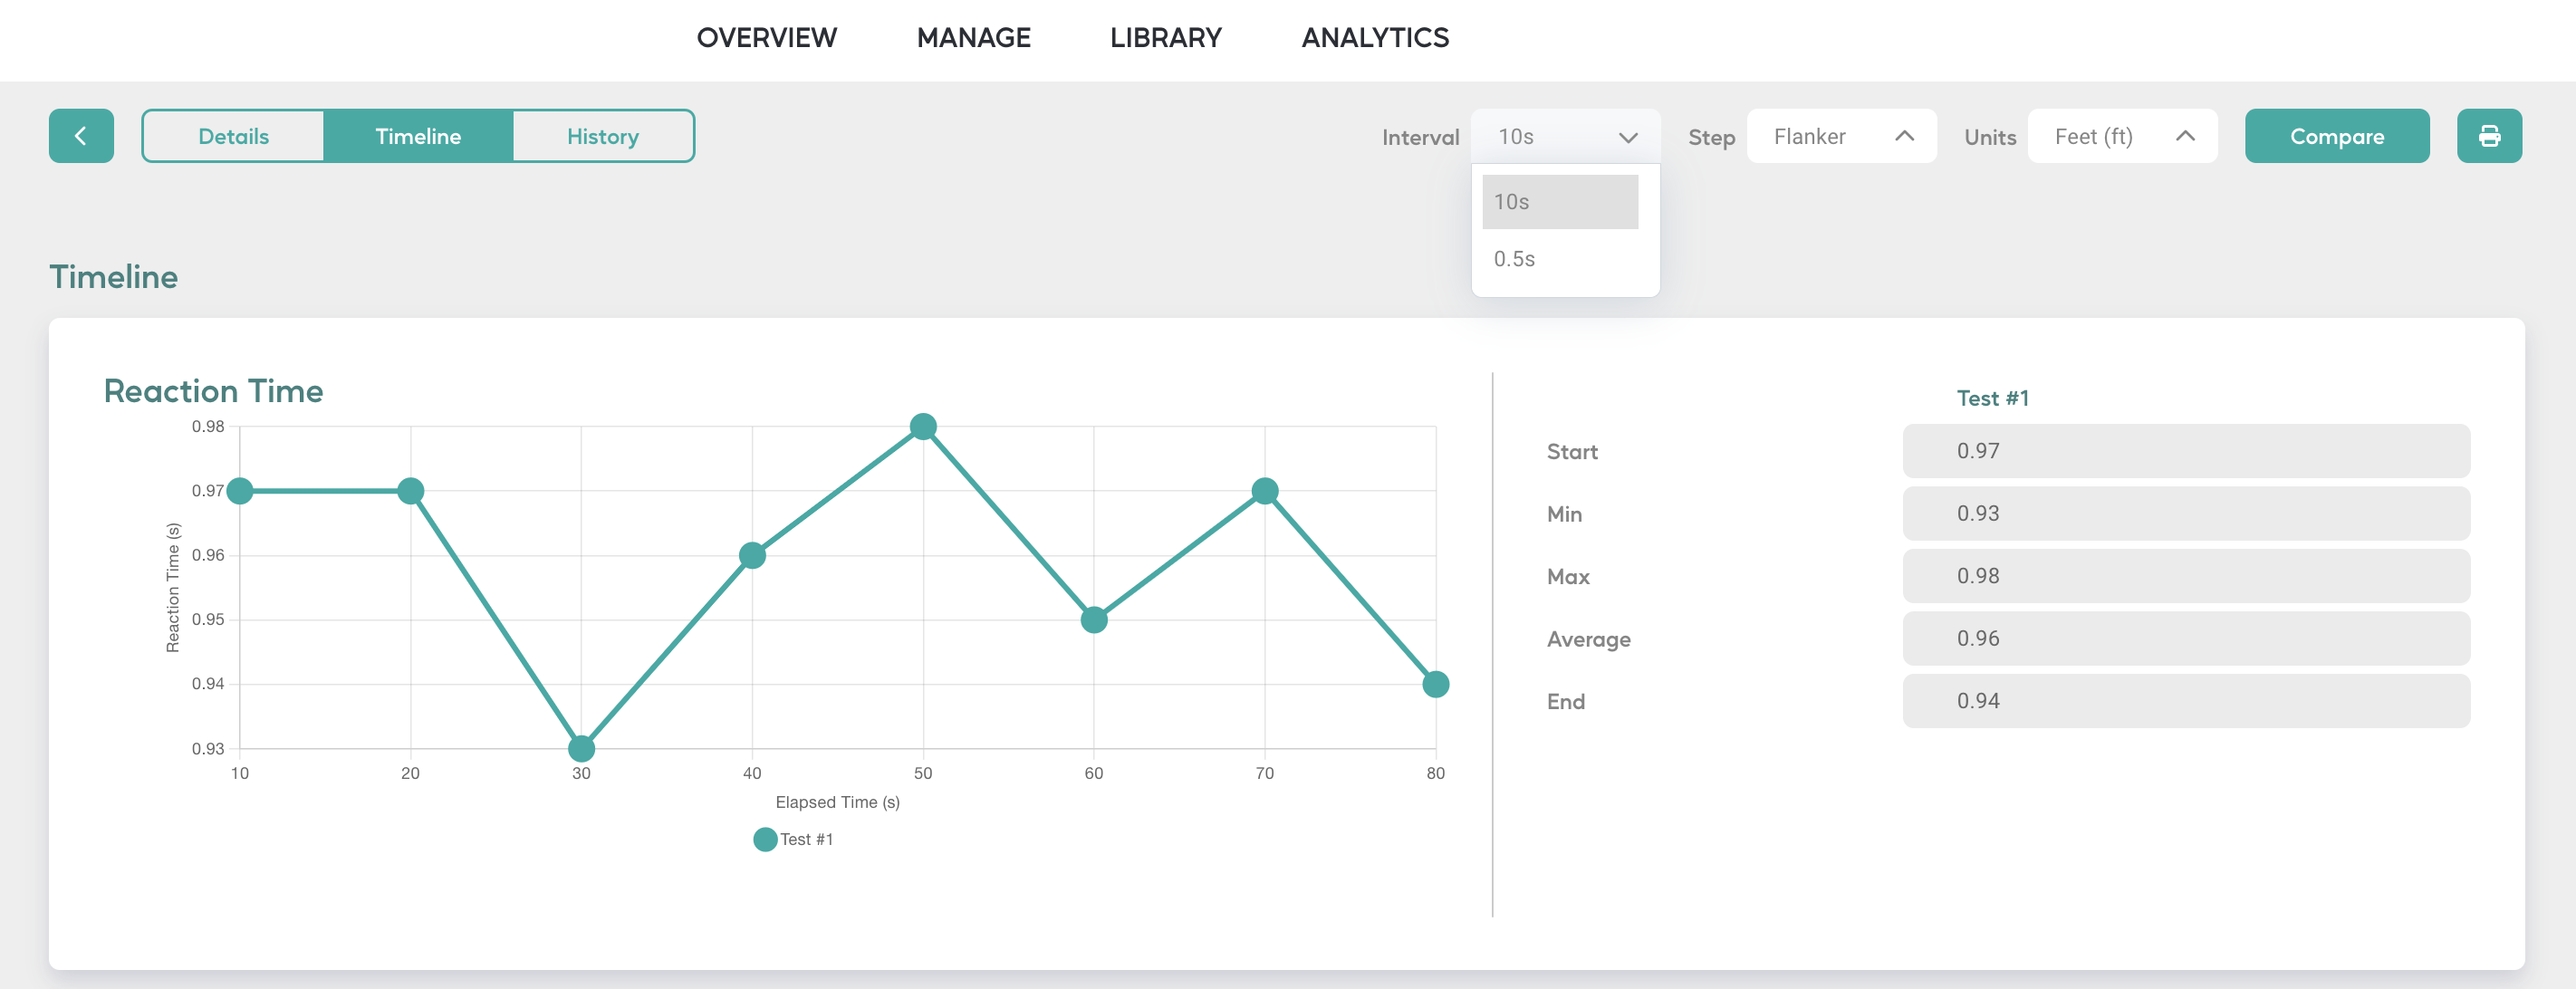
- Timeline Reports have a display option for the graph to switch between 10 second intervals and 0.5 second intervals. The 0.5 second interval option provides a visual of granular changes in the metric throughout the Activity. The 10 second interval display serves as an overview or trend and can be used to visualize fatigue.
- Added Symmetry Reporting for Reaction Time and Dynamic Reaction Time to Reach Activity Reports. Please note this is currently limited to Left and Right directions only.
.png?width=1535&height=860&name=image%20(32).png)
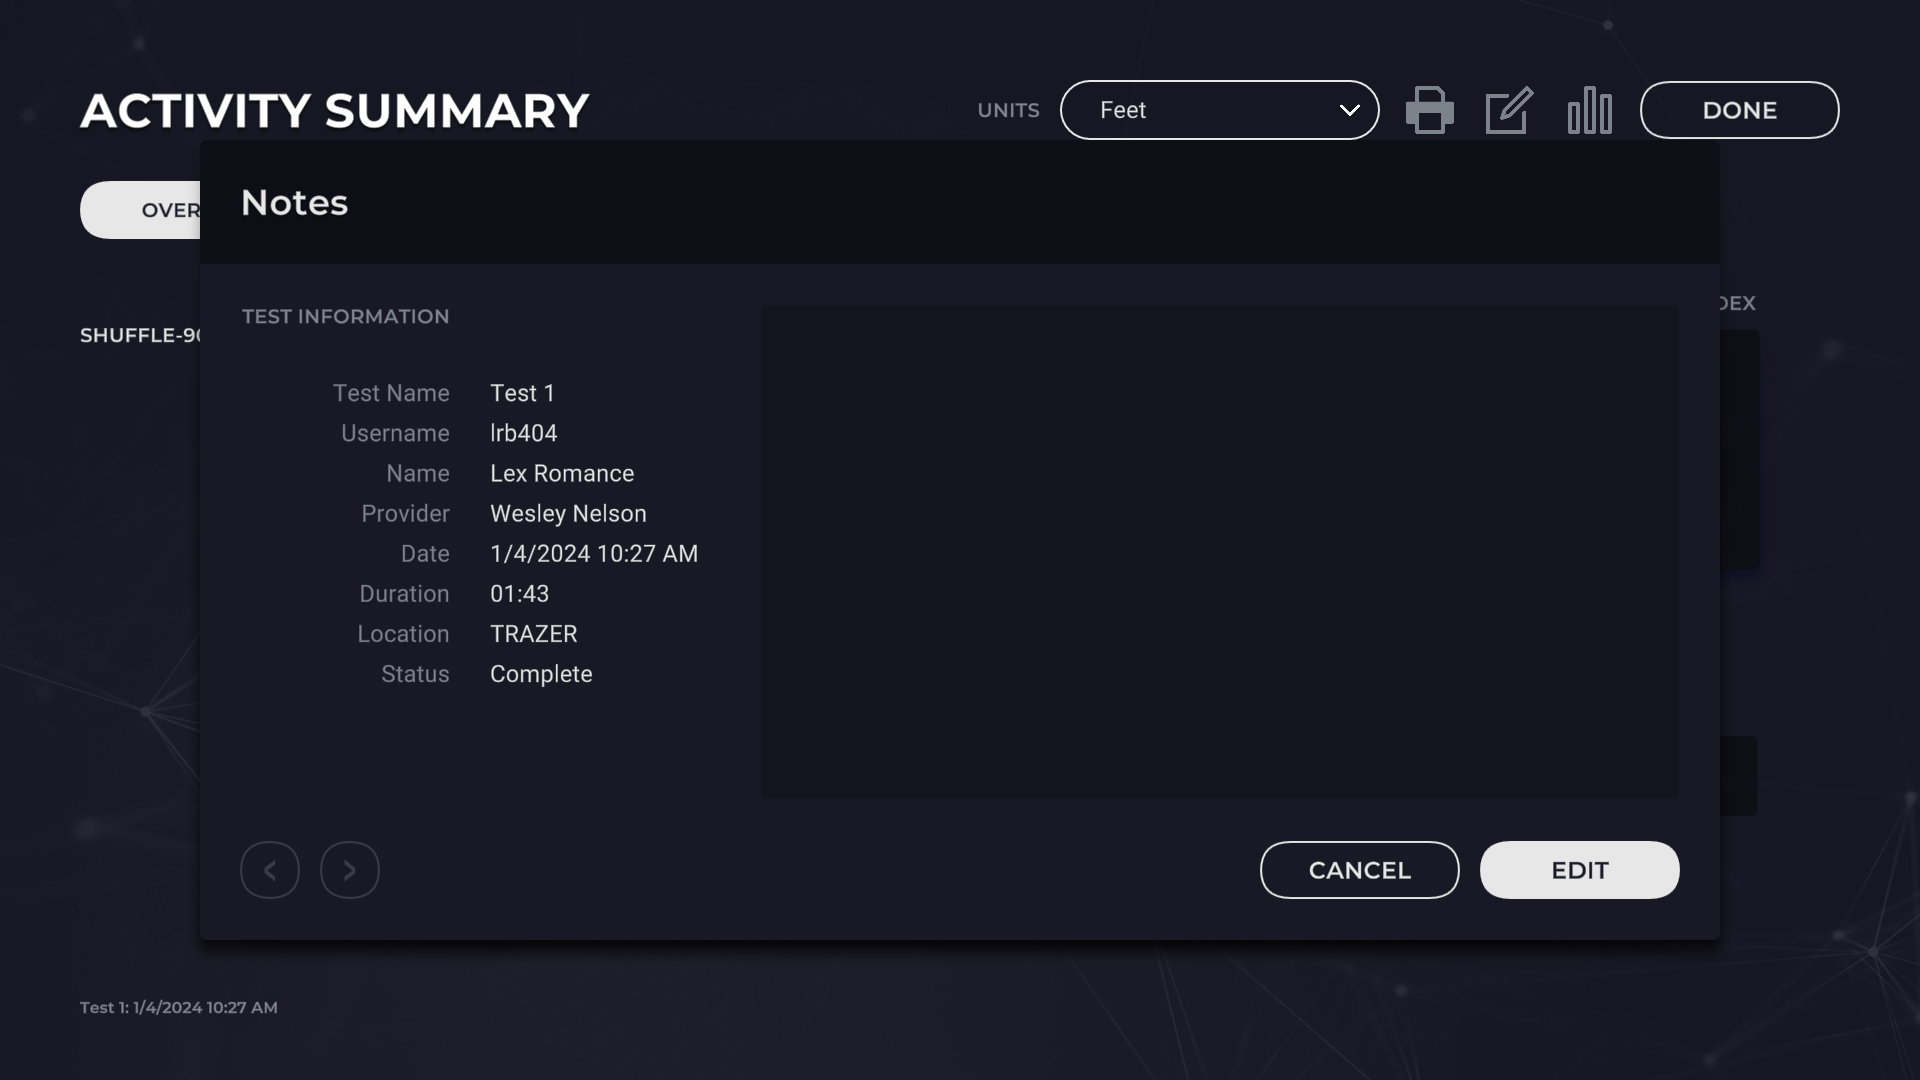
- Test Notes now display Test Information making it easier to recall specific details while reviewing historical reports or while comparing tests. Speaking of Test Information, the Test Date now displays in the bottom left corner to easily remember which test is being viewed.
- Kinematic Activities have a sound effect to signal the User to begin the Rep. (Use the television remote to adjust the volume.)

new FEATURES + FUNCTIONS
- Added the new Dynamic Reaction Time and Deceleration Index metrics in Dynamic Movement and Neuromechanics reports.
- Added Reps tables in Dynamic Movement and Neuromechanics reports.
- Introduced functionality to compare steps of a multi-step Activity
Enhancements
-
Cognitive Reports have been redesigned and now have two sections: Reaction Time and Responses.
-
Timeline Reports have a display option for the graph to switch between 10 second intervals and 0.5 second intervals for detailed data.
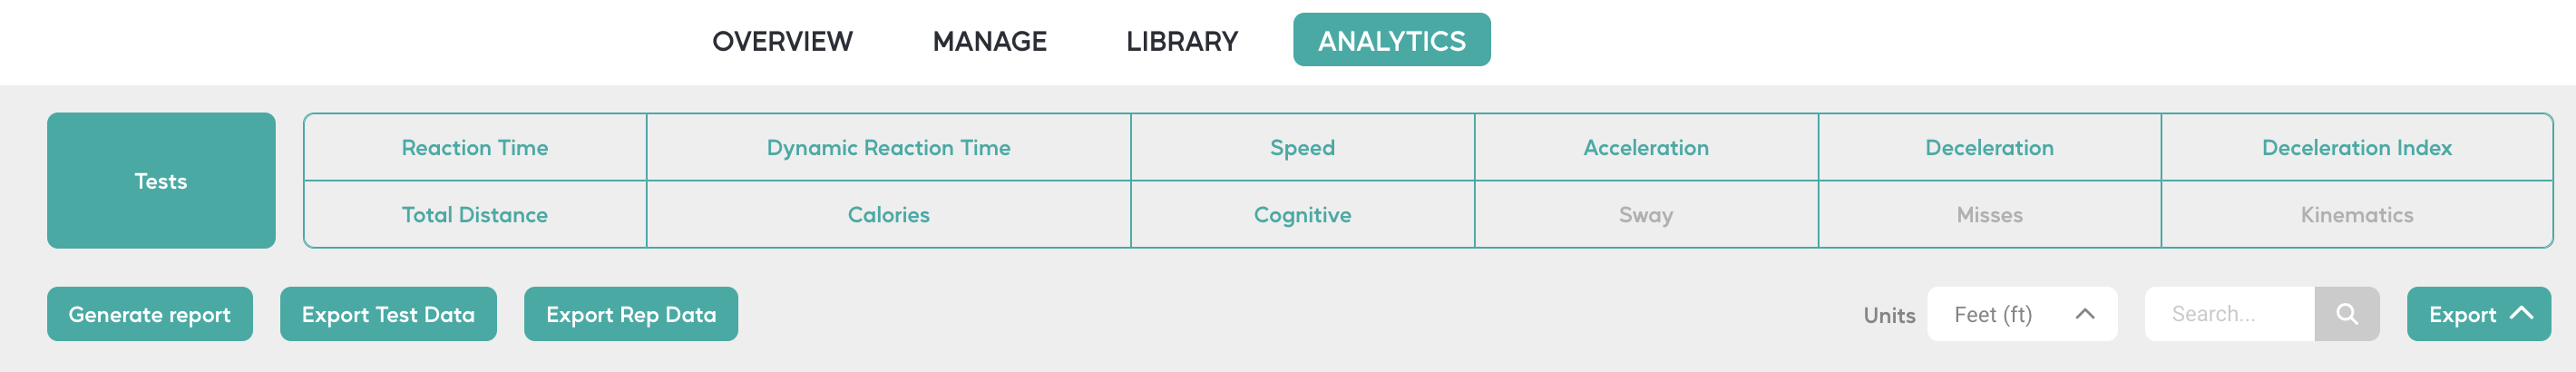
- The new Dynamic Reaction Time and Deceleration Index metrics can be viewed and analyzed in Analytics.
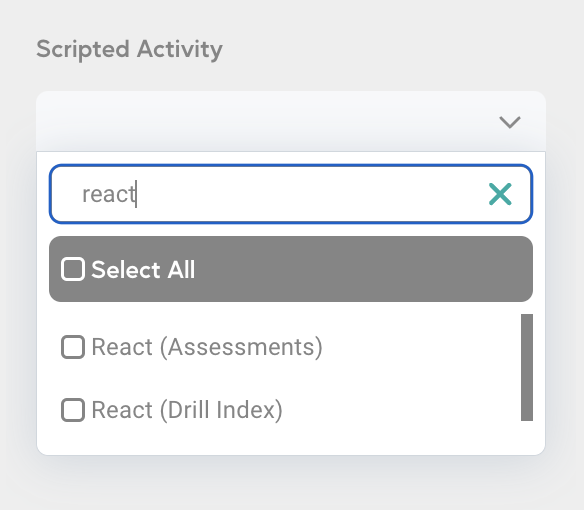
- All "Scripted Activity" drop-downs display the category of the Activity to easily distinguish between Assessments, Workouts, Rehabilitation, Drills, and Games.
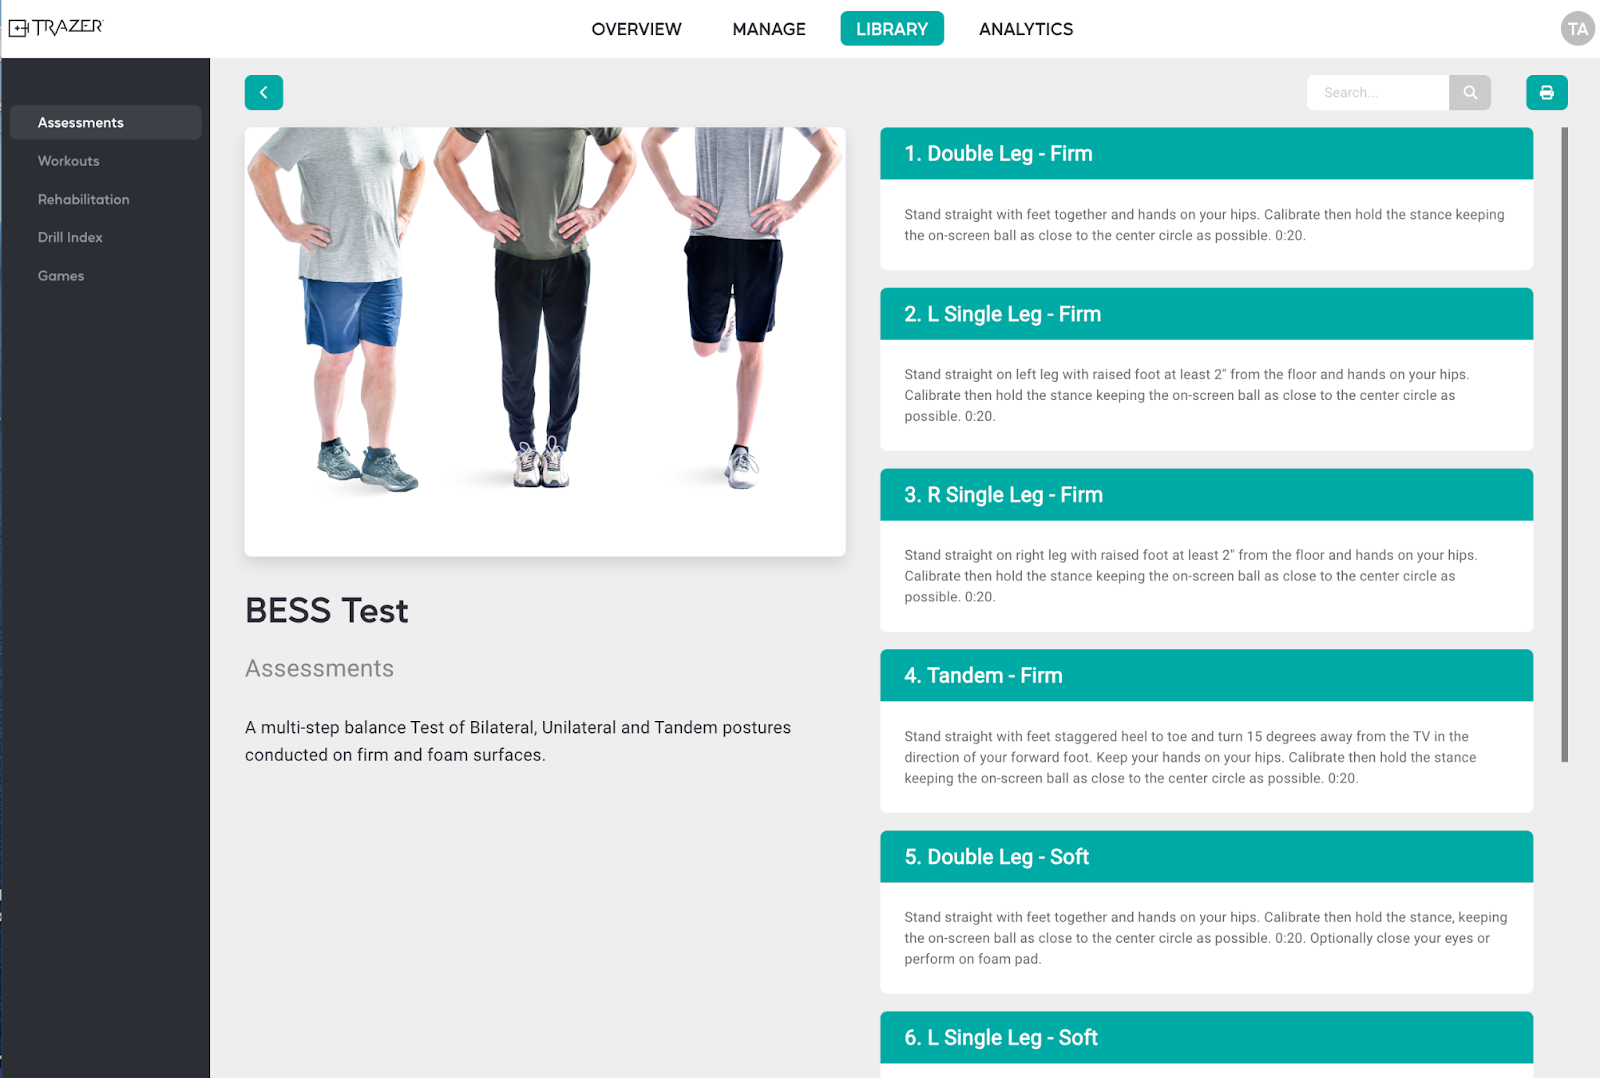
- The Library page has been updated to display instructions for each step of an Activity once "Learn More" is clicked. Additionally, this page can be printed to keep handy as a reference.
- Loading icons have been added to Analytics and Tests pages to indicate that an action has been requested but is not yet complete.
- "Neurocognitive" report sections have been renamed "Cognitive" to match the display of the software application.